"Hot sausage and mustard ..., cold jelly and custard, peas, pudding and saveloys."
"... a great big steak, fried, roasted, or stewed."
"Oh, food, wonderful food, marvellous food, glorious food."
If you recognised these lines about food, they're from the Lionel Bart song "Food Glorious Food", the opening song from the 1960s West End and Broadway musical (and 1968 film) Oliver!
Whenever I felt hungry, my stomach growled and rumbled loudly with slight discomfort and my mouth drooled. As a baby, I cried loudly trying to gain the attention of my parents or grandparents to feed me in order to stop the rumbling and to numb the pain in my belly. I don't remember much of the food they fed me when I was a baby boy, but I recalled it had rice, meat and vegetables. It is likely I would have made a mess and played with my food or spat out any food that I thought tasted disgusting. I don't remember the first food I took my first bite into, but if it tasted delicious, I would swallow it and smile to my parents that the food they fed me was tasty to me. If my hunger was satisfied, I felt a sense of joy from the fantastic flavours of the food I feasted on.
Now as an adult, whenever I feel hungry, I just walk over to the fridge, pantry or nearest cafe or restaurant and select the most appetising food such as last night's leftovers, fruit, nuts, or an appetising dish.
Your friends, family member, physician or nutritionist may have told you that eating nutritious food is the key to a fit and healthy lifestyle. In a literal sense, you are what you eat.
Or is it?
You would tend to agree with this phrase but have you considered asking yourself 'why we are what we eat?' To fully answer this simple but deep question, we need to understand what food is, how our body processes the food, how the food atoms become part of our bodies.
What is food?

Definition and classification of food
- Food is defined as any substance consumed to provide nutritional support and energy to the organism. It can be formulated, processed or raw, which can be consumed orally by animals to induce growth, health or pleasure.
- A majority of food contains carbohydrates, lipids, proteins, water, as well as minerals (e.g. salts) and organic substances (e.g. vitamins).
- A 2017 study by the Smithsonian Science Education Center stated plants, algae and a number of microorganisms generate their own food molecules through the process of photosynthesis.
- Zoroddu et al. (2019) found several inorganic (non-food) elements also play an important role in augmenting plant and animal functioning.
- Each food carries varying levels of energy densities, or calories depending on the nutrients it carries. For example, high-fat foods have higher energy densities, thus have greater calories.
- Human food can be classified either by related content or the method by which the food is processed.
The Food and Agriculture Organisation and World Health Organisation produced the following list of 19 food classifications:
1. Cereals / Grains (Refined or whole)
2. Bread
3. Roots
4. Pulses and nuts / legumes
5. Milk
6. Eggs
7. Fish and shellfish
8. Meat (Red or processed)
9. Insects
10. Vegetables
11. Fruits
12. Fats and oils
13. Sweets and sugars
14. Spices and condiments
15. Beverages
16. Foods for nutritional uses
17. Food additives
18. Composite dishes
19. Savoury snacks
Where does food usually originate?

- In a given ecosystem, a food web of interlocking chains starts with primary producers at the bottom and apex predators at the top. Some food webs may include detrovores (organisms eating detritis) and decomposers (organisms breaking down dead organisms).
- Primary producers include algae, bacteria, plants and protists that obtain energy directly from sunlight.
- The primary consumers are the herbivores that consume the plants and secondary consumers are the carnivores that consume the herbivores. Omnivores, including most mammals and birds, consume both animals and plants.
- The food chain terminates with the apex predators, which are animals with no known predators in the ecosystem, e.g. humans.
- In 2021, the National Geographic Society argued humans are omnivores that acquire sustenance in cooked meat, eggs, fruits, milk, mushrooms, seaweed and vegetables.
- In 2017, the National Geographic Society described the cereal grain as a staple food that provides the most food energy than any other type of crop worldwide. Studies estimated about 87% of all grain production worldwide consist of corn (maize), wheat and rice.
- In 2014, Brad Plumer estimated about 55% of the world's crops are consumed by humans, 36% are used as animal feed and 9% for biofuels.
- Enzo Palombo (2022) stated fungi and bacteria are utilised by different food industries to prepare fermented foods such as bread, cheese, wine, and yogurt.
i. Sunlight and soil

- Messinger, Ishitani & Wang (2018) described photosynthesis as the ultimate source of energy and food for virtually all life on earth. It is regarded as the main food source for algae, plants and several types of bacteria. This process is essential for maintaining many food chains, particularly secondary consumers that rely on primary consumers.
- Algae, plants and certain bacteria absorb energy from sunlight in order to transform water and carbon dioxide in the air or soil into oxygen and glucose. This leads to the production and release of oxygen and the storage of glucose as an energy reserve.
- In addition, plants absorb essential nutrients and minerals from the air, soil and water, such as carbon, oxygen, hydrogen, as well as nitrogen, phosphorus, potassium, calcium, sulfur, magnesium, iron boron, chlorine, manganese, zinc, copper molybdenum and nickel. in order to ensure its survival.
ii. Plants

- As a food source, plants are categorised as grains, fruits, legumes, nuts, seeds and vegetables.
- Fruit is defined as the consumed part being derived from the reproductive tissue, e.g. seeds, nuts and grains. For example, tomatoes, eggplants, pumpkins, peppers, cucumbers, peas, string beans are technically fruit, rather than vegetables.
- Rejman et al. (2021) stated fruits, from a culinary perspective, are regarded the remains of botanically described fruits after nuts, seeds and fruits used as vegetables are removed.
- Nuts are defined as dry fruits with a woody shell.
- Grains are defined as seeds that are consumed or harvested by humans, e.g. cereal grains (barley, corn, millet, oats, rice, rye, sorghum, wheat) belong to the Poceae (grass) family, and pulses belong to the Fabaceae (legume) family. Whole grains contain all of the components of the original seed (bran, endosperm, and germ).
- Stone fruits (e.g. cherries and peaches)
- Pome fruits (apples, pears)
- Berries (blackberry, strawberry)
- Citrus (lemon, cherries)
- Melons (cantaloupe, watermelon)
- Mediterranean fruits (grapes, figs)
- Tropical fruits (bananas, pineapple).
Vegetables are defined as any part of the plant that can be consumed, which includes bark, leaves, flowers, roots, stems, or the entire plant itself. They are categorised into:
- Root vegetables (carrots, potatoes)
- Bulbs (onions)
- Flowers (Cauliflower, broccoli)
- Leaves (Lettuce, spinach)
- Stems (Asparagus, Celery)
- Plants have high carbohydrate, lipid, and protein content, with carbohydrates existing in the form of glucose, fructose, starch, and other sugars.
- A majority of vitamins are found in plants, except for vitamin D and vitamin B12. Although plants are enriched with minerals, the existence of phytates block their release.
- Fruit has high water content, as well as high levels of simple sugars and vitamin C. Compared to fleshy fruit (with the exception of bananas, vegetables have a higher amount of dietary fibre, folate, vitamins, potassium and starch, and have a lesser amount of fat and calories.
- Grains contain high levels of starch, while nuts contain high levels of fibre, protein, vitamins B and E. Seeds have higher levels of fibre and healthy fats, such as omega-3 fats.
Herbivores = Eats only plantsFrugivores = Eats primarily fruit; Studies found frugivores include a diverse range of species from annelids to elephants, chimpanzees, as well as numerous birds and fish.
Folivores = Eats shoots and leavesXylophages = Eats wood
- John Warren (2022) found humans eat roughly 200 of the world's approximately 400,000 plant species, despite at least 50% of them being considered edible. Furthermore, a majority of the plant-based food humans consume originate from maize, rice, and wheat.
- Anthony Fardet (2017) stated plants are processed in a variety of foods such as breads, cereals, juices, jams, pasta, as well as raw ingredients such as herbs, sugar, spices, oils.
- Pressing oilseeds would produce rich oils such as flaxseed, rapeseed (inc. canola oil), sesame, and sunflower.
- Ove Eriksson (2014) thought the coevolution of numerous animals and fruits resulted in fruit being an excellent source of nutrition to the animal, which subsequently excretes the seeds after travelling a long distance to increase the fruit's dispersal.
- Heleno et al. (2011) found some mutual benefits of seed predation since a number of seeds survive the digestion process.
- Studies found insects are big consumers of seeds, with ants being the only insect known to disperse seeds. Despite being major seed dispersers, Elizabeth Jennings (2019) found birds rarely consume seeds as a source of food and are distinguished by their thick beaks used to crack open the seed coat.
- Carpenter et al. (2020) stated mammals consume a diverse range of seeds since they can crush sturdier and larger seeds with their teeth.
iii. Animals / Livestock

- Food derived from animals include eggs, meat, shellfish and dairy products such as cheese and milk. They are an abundant source of protein since they contain essential amino acids not naturally produced by the human body.
- In addition, animal products contain other nutrients such as calories, fat, essential vitamins (e.g. B12) and minerals (e.g. calcium, iron, magnesium, zinc)
- 1 x 110g (4-ounce) steak, chicken breast or pork chop = 30 grams of protein
- 1 x large chicken egg = 7 grams of protein
- 1 x 110g (4-ounce) serving of cheese = 15 grams of protein
- 1 cup of milk = 8 grams of protein.
- Food products originated from animals include milk produced by mammary glands, which is either drunk or processed into dairy products such as butter, cheese, etc.
- Animals such as birds lay eggs, which are often consumed.
- Bees produce a reduced nectar from flowers called honey, which is a popular sweetener in numerous cultures.
- Animal blood is consumed in some cultures, occasionally in the form of blood sausage, as a thickener for sauces, or in a cured, salted form for times of famine, or in stews such as jugged hare.
What is a food crop?

- In farms and fields across the world, plants are grown and harvested in abundance for profit or sustenance. In agriculture or hydroponics, when plants of the same kind are cultivated in one location at an enormous scale, there are called crops.
- A majority of crops are typically harvested as food for humans or fodder for livestock. Some crops are collected from the wild typically in the form of intensive gathering (e.g. ginseng, yohimbe, and eucommia).
Depending on the region, the most common crops grown globally includes:

Note that a number of the globally minor crops are grown abundantly in certain regions. For example, roots & tubers are grown in Africa at 421 kcal/person/day, whereas sorghum and millet are grown at 135 kcal and 90 kcal per person per day, respectively.


In terms of produced weight, the following crops are the most crucial ones (global production in 1000 metric tonnes):

Others include macroscopic fungus (e.g. mushrooms) and marine macroalga (e.g. seaweed), some of which are grown in aquaculture, as well as:
- Horticulture crops = Plants used for other crops (e.g. fruit trees).
- Floriculture crops = Bedding plants, houseplants, flowering garden and pot plants, cut cultivated greens, and cut flowers.
- Industrial crops = Clothing (fiber crops e.g. cotton), biofuel (energy crop i.e Jatrophas, algae fuel), or medicine (medicinal plants).

Today, about 1/3 of the world's food is produced by the farms (big and small), from which they get transported to the local markets or supermarkets. The major agricultural food produced by the farms include cereals (grains), fruits, vegetables, cooking oils, meat, milk, eggs, and fungi.
- Dairy farms: Milk, milk products such as cream, cheese and butter, beef or veal meat
- Poultry farms: Meat and eggs of chickens, turkeys, ducks, and other fowls
- Pig farms: Bacon, ham or pork products
- Fisheries / Aquaculture: Seafood
- Grain farms: Fine grains such as wheat, barley, rye
- Orchards: Fruit, Nuts
- Garden patches: Vegetables
- Vineyards: Grapes, Wines
It is estimated that about 11 million tonnes of food is produced globally. However, approximately 14% of the world's food is lost from production prior to making the retail shelves, which is caused by a multitude of factors. Crop and livestock production, as well as aquaculture, fisheries and forestries are encompassed by agriculture.
Nowadays, modern agronomy, plant breeding, agrochemicals (e.g. pesticides and fertilisers), and technological advancements (e.g. genetically modified organisms (GMOs)) have significantly increased crop yields, however they pose negative effects environmentally and ecologically. Selective breeding and modern procedures in animal husbandry have significantly increased the output of meat products, but there are concerns about its impact on animal welfare and the environment.
I'll delve into the history and details of agriculture and farming in another post.
What is a food web?

- A food web is a graphical representation of interconnecting food chains that illustrates which organism eats which organism in an ecological community.
- Food webs are described as the road-maps through Darwin's famous 'entangled bank', and ecologists acknowledged the complexity of food webs. Pimm et al. (1991) demonstrated the pattern of food webs is often shared in a diverse range of terrestrial, freshwater, and marine communities.
Who first conceptualised food webs?
- Food webs were first described by a medieval Afro-Arab scholar named Al-Jahiz when he said "All animals, in short, cannot exist without food, neither can the hunting animal escape being hunted in his turn."
- In 1880, Lorenzo Camerano published the first graphical representation of a food web, which was followed independently by Pierce and co. in 1912 and Victor Shelford in 1913.
- Victor Summerhayes and Charles Elton in 1923 and Alister Hardy in 1924 published food webs about herring on Bear Island (figure below).

- In 1927, Charles Elton subsequently introduced the concept of food cycles, food chains, and food size in his classical book "Animal Ecology". The concept of organising species into functional groups inspired the trophic system of classification in Raymond Lindeman's 1942 publication on trophic dynamics.
- The idea of a food web includes concepts described by Charles Darwin, such as "entangled bank", "web of life", "web of complex relations" and "the continued movement of the particles of earth" in reference to the decomposition actions of earthworms.
- Studies referenced John Bruckner's 1768 description of nature as "one continued web of life".
- Robert Paine's 1966 experimental and informative study of intertidal shores elevated the research interest in food webs, which indicated the complexity of food webs played a key role in maintaining biodiversity and ecological stability.
- This discovery motivated theoretical ecologists, such as Sir Robert May and Stuart Pimm to investigate the mathematical properties of food webs.
Describe the taxonomy of the food web
 |
| This is a simplified food web representing a three trophic food chain (producers-herbivores-carnivores) connected to decomposers. The movement of mineral nutrients is cyclic, whereas the movement of energy is unidirectional and noncyclic. Trophic species are encircled as nodes and arrows depict the links. |
- All life forms are broadly categorised into trophic layers: autotrophs and heterotrophs. Autotrophs produce more biomass energy, either chemically without the sun's energy or by capturing the sun's energy in photosynthesis, than they use during metabolic respiration.
- Heterotrophs consume instead of produce biomass energy as they metabolise, develop, and increase levels of secondary production.
- Studies by Pimm et al. (1991), Odum & Barrett (2005) and Benke (2010) described food webs as a representation of the collection of polyphagous heterotrophic consumers that network and cycle the flow of energy and nutrients from a productive base of self-feeding autotrophs.
- The basal species in a food web don't have prey, which includes autotrophs or saprophytic detritivores (i.e., the community of decomposers in soil, biofilms, and periphyton).
- The feeding connections between each organism throughout the food web are called trophic links.
- Clustered within the trophic links of food webs are the food chains, which are linear (noncyclic) feeding pathways that depict monophagous consumers from a base species up to the top consumer, typically a larger predatory carnivore.
- Food webs contain nodes, which are collections of biological taxa called trophic species. Moreover, trophic species are functional groups with the same predators and prey in a food web.
- Post (2002) stated common examples of an aggregated node in a food web include consumers, decomposers, microbes, parasites, predators, or saprotrophs, each containing numerous species in a food web that may otherwise be linked to other trophic species.
i. Trophic levels

- The trophic level of an organism is defined as the position on a food web, as well as the number of steps it is from the start of the chain.
- The term trophic originates from the Greek word τροφή (trophē) meaning food or nourishment.
- Trophic levels were first conceptualised by Raymond Lindeman in 1942, based on the terminology used by August Thienemann in 1926: "consumers", "producers", and "reducers" or "decomposers".

The 3 basic methods organisms use to obtain food are:
- Autotrophs (Producers) = Usually algae or plants. They don't eat other organisms, but draws nutrients from the soil or the ocean and produce their own food via photosynthesis. Therefore, they are labelled primary producers. The sun's energy activates the base of the food chain. One exception occurs in deep-sea hydrothermal ecosystems, where sunlight doesn't reach those depths. The primary producers in the deep seas manufacture food through chemosynthesis.
- Heterotrophs (Consumers) = These species are unable to produce their own food, and thus have to consume other organisms. Herbivores eat the primary producers (e.g. plants), carnivores eat other animals, and omnivores eat both plants and other animals.
- Detritivores (Decomposers) = They decompose dead animal and plant material and wastes and release it as energy and nutrients into the ecosystem for recycling. Decomposers (e.g. bacteria and fungi or mushrooms) feed on waste and dead material by converting it into inorganic chemicals that are subsequently recycled as mineral nutrients to plants to utilise again, which restarts the food chain.

- In real-world ecosystems, a majority of organisms are in more than 1 food chain because they consume more than 1 kind of food or are consumed by more than 1 type of predator.
- Almost all plants and phytoplankton are phototrophic and are at exactly level 1.0. A 2014 study estimated numerous worm species are at roughly level 2.1; insects level 2.2; jellyfish level 3.0; birds 3.6.
- In 2013, Bob Yirka estimated the average trophic level of humans to be around 2.21, similar to anchovies or pigs.
- Note that these values are averages, and both ancient and modern human eating habits are complex and can vary significantly. For example, a traditional Inuit that consumes mainly seals would have a trophic level of around 5.
Describe the efficiency of biomass transfer

- Generally, there is a relationship between each trophic level and the one beneath it by absorbing a proportion of the energy it consumes, which is based on, or supported by, the next lower trophic level.
- Food chains illustrate the amount of energy being transferred from one feeding level to the next in a food chain, known as an energy pyramid (shown in the figure above).
- The energy transferred between each trophic level is an estimation of the transfer of biomass, thus there is greater consumption of biomass at lower trophic levels.
- Behrenfeld (2014) stated that rapid growth and consumption of primary producers can lead to low biomass at any stage, e.g. phytoplankton (producer) biomass can be low compared to the zooplankton (consumer) biomass in the same body of water.
- How efficient energy or biomass is transferred from one trophic level to the next is referred to as the ecological efficiency. At each level, consumers convert roughly 10% of the chemical energy in their food to their own organic tissue (i.e. the 10% law), therefore food chains rarely exceed level 5 or 6.
- At the lowest trophic level, plants convert roughly 1% of the sun's energy into chemical energy. As a result, the total energy originally from the incident sunlight that the tertiary consumer receives is approximately 0.001%.
What are fractional trophic levels?
- Trophic levels aren't always integers because organisms tend to feed at more than 1 trophic level. For example, large carnivores can eat both smaller carnivores and herbivores, e.g. the bobcat eats rabbits, but the mountain lion eats both bobcats and rabbits.
- Pauly & Palomares (2005) proposed a formula to define the trophic level (TL) for any consumer species as:

TLj = Fractional trophic level of the prey j
DCij = Fraction of j in the diet of i
Consumer Trophic Level (TLi) = 1 + Weighted average of contribution of different trophic levels to its food
- In marine ecosystems, the trophic level of a majority of fish and other marine consumers ranges from 2.0 to 5.0. Pauly et al. (1998) stated that trophic level 5.0 occurs in apex predators of marine mammals, such as orcas and polar bears.
- Gorlova et al. (2015) found the trophic level can be quantified through stable isotope analysis of animal tissues, such as bone collagen, hair, muscle and skin, in addition to observations of animal behaviour, and quantification of animal stomach contents.
- They discovered an approximate 3-4% increase in the nitrogen isotopic composition at each trophic level due to the fractionations that occur with the synthesis of biomolecules.
What is the mean trophic level for fisheries?
In fisheries, the mean trophic level for the fisheries catch across an entire area or ecosystem is calculated for year y using the formula below:

Yiy = Annual catch of the species or group i in year y
TLi = Trophic level for species i as defined above
- Fish at higher trophic levels, such as tuna, have a greater economic value, which lead to overfishing at the higher trophic levels.
- A 2005 Millennium Ecosystem Assessment discovered reductions in the average trophic level of fisheries catch, which is referred to as 'fishing down the food web'.
- However, Sethi et al. (2010) found no relationship between economic value and trophic level, which suggested mean trophic levels in catches, surveys and stock assessments actually didn't decrease. This indicated the fishing down the food web phenomenon doesn't occur globally.
- Pauly et al. highlighted that fish trophic levels peaked at 3.4 in 1970 in the northwest and west-central Atlantic, then a subsequent decrease in 1994 to 2.9. They discovered fisheries adapted to changes in the relative abundance of the preferred catch by moving away from long-lived, piscivorous, high-trophic-level bottom fishes (e.g. cod, haddock) to short-lived, planktivorous, low-trophic-level invertebrates (e.g., shrimp) and small, pelagic fish (e.g., herring). This demonstrated signs of the global fishery collapse, with the overfished Mediterranean Sea as an example.
- Bonhommeau et al. (2013) found the average trophic level of humans is roughly 2.21, which is a similar value to the average trophic level of a pig or an anchovy.
What is FiB index?
Since biomass transfer efficiencies are about 10%, the rate of biological production is significantly elevated at lower trophic levels than it is at higher levels. Initially, fisheries catch are likely to increase as the trophic level decreases. At this point, the fisheries tend to target species on the lowest levels in the food web.
In 2000, Pauly et al. developed a "Fisheries in Balance" index, known as FiB index, which is defined, for any year y, as:

Yy = Catch at year y
TLy = Mean trophic level of the catch at year y
Y0 = Catch
TL0 = Mean trophic level of the catch at the start of the series being analysed
TE = Transfer efficiency of the biomass or energy between trophic levels
- The FiB index is stable (zero) over periods when alterations in trophic levels are matched by catch adjustments in the opposite direction.
- If catches increase due to higher fish biomass, geographic expansion, etc., then the FiB index increases.
- Pauly et al (1998) found decreases in FiB index explain the "backward-bending" plots of trophic level compared to the catch.
ii. Trophic dynamics and multitrophic interactions
- Cousins (1985) and Lindeman (1942) described the basis of trophic dynamics as the transfer of energy from one component of the ecosystem to another.
- Although the trophic dynamic concept is a useful quantitative heuristic, it carries several major limitations such as the precision by which an organism can be allocated to a specific trophic level. For example, omnivores can be allocated to any trophic level rather than restricted to a single level.
- Thompson et al. (2007) stated that food webs do contain distinct trophic levels, however trophic levels above the herbivore trophic level are accurately depicted as a tangled web of omnivores.
- Ecologists use simplified food chain models (producer, carnivore, decomposer) containing one trophic position to investigate different types of ecological control mechanisms. For example, the top-down hypothesis or 'green-world' hypothesis suggests herbivores have an abundance of vegetative resources, which indicates predators mainly control or regulate their populations.
- Polis & Strong (1996) argued that some plant material is inedible and the nutritional quality or anti-herbivore defences of plants gives the impression of bottom-up model of control or regulation.
- Hoekman (2010) deduced that both "top-down" and "bottom-up" forces can impact community structure and the magnitude of the impact is environmentally context-dependent.
- Tscharntke & Hawkins (2002) stated these complex multitrophic interactions entail more than 2 trophic levels in a food web. Babikova et al. (2014) discovered an example of multitrophic interactions in the context of arbuscular mycorrhizal fungi and aphid herbivores that use the same plant species.
- A trophic cascade is another example of a multitrophic interaction that involves predators augmenting growth of plants and suppressing herbivores in order to prevent overgrazing.
- Predators generally consume herbivores to indirectly affect the control and regulation of primary production in plants. Although predators directly avoid the plants, they manage the population of herbivores that are directly associated with plant trophism. The net effect of these direct and indirect relations results in trophic cascades.
- Species-level cascades involve only a subset of the food web being affected by a change in population numbers, whereas community-level cascades involve the entire food web being considerably affected by the a change in population numbers.
- Haan et al. (2021) found a number of plant species in the Castilleja and Plantago genera produced defensive substances called iridoid glycosides that are sequestered in the tissues of the Taylor's checkerspot butterfly larvae. This larvae developed a tolerance for iridoid glycosides, which allows it to eat the foliage of these plants. Moreover, these sequestered iridoid glycosides subsequently provide chemical protection against bird predators to the butterfly larvae.
- Lehtonen et al. (2005) found endophytes living within a grass host produced defensive alkaloids to protect itself against a hemiparasitic plant that also employed the grass as a host.
iii. Energy flow and biomass
 |
| A food pyramid (left) and food web (right) illustrating some of the patterns in a food web. |
- Energy flow is defined as the flow of energy within an ecosystem through living organisms, which can be classified as producers and consumers and then arranged into a food chain.
- In order to demonstrate the quantity of organisms at each trophic level, food chains are arranged into trophic pyramids. The arrows in the food chain indicate the unidirectionality of energy flow, with the head of the arrow specifying the direction of energy flow, with some energy lost at every step due to heat.
- Sharma (2009) stated that thermodynamics determine the unidirectional flow of energy and the successive loss of energy during its transition up the food web.
- Trophic dynamics shares concepts with thermodynamics since it concerns the transfer and transformation of energy to and among organisms, as well as externally from the sun.
Describe the energetics of the carbon cycle
- The first stage in energetics is photosynthesis, which involves water, carbon dioxide and solar energy reacting together to produce oxygen and glucose.
- The reverse reaction is cellular respiration, which involves oxygen and sugar reacting together to produce carbon dioxide and water, which is then recycled back into plants.
- Energy loss is typically measured either by efficiency (i.e. amount of energy required to transition to the next trophic level), or by biomass (i.e. amount of living material that exists at those levels at one point in time).
- 10% of energy at the producer trophic level moves to the primary consumers level, and then 10% of the remaining energy moves to the next trophic level, and so on up the food pyramid.
- Ecological efficiency ranges between 5% and 20% depending on the efficiency of the ecosystem. A lower efficiency indicates the organisms require cellular respiration to survive, and some energy is lost in the form of heat during cellular respiration.
 |
| This diagram is the carbon cycle of a terrestrial ecosystem. It starts with photosynthesis, with carbon dioxide (white) and water (blue) from the air being absorbed by the plants along with solar energy (yellow), which is then converted into plant energy (green). About 100x1015grams of carbon/year is fixed by photosynthetic organisms, which is equivalent to 4x10¹⁸kJ/yr of free energy. |
What is primary production?
- Primary producers are involved in photosynthesis by converting carbon dioxide, water and the solar energy into glucose and oxygen. Moreover, they utilise the energy stored in glucose to undergo cellular respiration.
- If the producer is consumed by herbivores in the preceding trophic level, then a portion of the energy is transferred up the food pyramid. The glucose stored within producers function as a food source for consumers, thus consumers can only access the solar energy through producers. Examples of primary producers include algae, mosses, grasses, trees, shrubs, etc.
- Chemosynthetic bacteria undergo a similar process called chemosynthesis, but absorbs the energy stored in chemicals such as hydrogen sulfide rather than the sun's energy. This is because this process occurs deep in the ocean at hydrothermal vents that release heat and chemicals such as hydrogen, hydrogen sulfide and methane.
- Chemosynthesis involves the energy in the chemical bonds of hydrogen sulfide and oxygen being used to convert carbon dioxide to glucose, as well as produce water and sulfur.
- Sigman & Hain (2012) found one of the factors that influence primary production is the amount of energy absorbed by the producer(s), which is measured using productivity. They calculated the producer absorbs only 1% of solar energy, with the remaining 99% rebounding or passing through.
- Cebrian (1999) defined gross primary productivity as the actual amount of energy the producer receives. Amthor & Baldocchi (2001) estimated about 60% of the energy absorbed by the producer is used for the producer's respiration.
- The net primary productivity is defined as the amount of energy retained by the plant after the amount of energy used for cellular respiration is deducted.
What is secondary production?
- Secondary producers such as plants store the energy converted by consumers to their own biomass. A majority of energy is stored in the organic matter of plants, which is then transferred to the consumers (i.e. herbivores and omnivores) that consume these plants. Carnivores subsequently consume the herbivores and/or omnivores to gain this energy.
- A considerable portion of energy in primary production eventually become litter or waste, known as detritus. Microbes, bacteria, fungi, macroinvertebrates, and meiofauna are part of the detrital food chain.
- Allan & Castillo (2007) stated these organisms are consumed by omnivores and carnivores, which comprise of a significant portion of secondary production.
- Smith & Smith (2015) found the efficiency of the secondary consumption of organisms can vary widely, and the efficiency of energy transfer to the consumers is estimated to be around 10%.
i. In aquatic environments
- The main contributors to secondary production in aquatic ecosystems are the heterotrophs, which depend on primary productivity and the net primary products.
- Autochthonous and allochthonous are the main organic sources of carbon in aquatic ecosystem for herbivores and decomposers to consume.
- Authochthonous carbon originates from within the ecosystem, which includes algae, aquatic plants and phytoplankton. In contrast, allochthonous carbon originates from outside the ecosystem, which comprises of mainly dead organic matter from the terrestrial ecosystem entering the aquatic environment.
- Fisher & Likens (1973) estimated about two thirds of the annual energy input in stream ecosystems is washed downstream, with the remaining one third being consumed and lost as heat.
ii. In terrestrial environments
- The assimilation efficiency is expressed by the amount of food digested by the consumer, the amount assimilated by the consumer and the expulsion of faeces or urine. Some energy is used for respiration, and some other energy is used for biomass in the consumer.
- The first major food chain is the energy originating from autotrophs and transferred to the consumers, and the second major food chain involves carnivores consuming herbivores or decomposers consuming the autotrophic energy.
- Smith & Smith (2015) reported carnivores have about 80% assimilation efficiency of energy, whereas herbivores have between 20 and 50% assimilation efficiency of energy.
- Fisher & Likens (1973) estimated the energetic consumption by herbivores in terrestrial ecosystems to be between 3% and 7%. There is relatively low fluctation in the amount of net primary product consumed by herbivores.
What are detritivores?
- Detritivores consume decomposing organic material, which are in turn consumed by carnivores. Since predator productivity correlates with prey productivity, this vindicates the principle that the primary productivity in ecosystems impacts all productivity ahead of it.
- Hairston Jr & Hairston Sr (1993) estimated about 62% of the organic material in temperate forests is mainly composed of dead plants, which indicates detritus makes up a significant portion of organic material in ecosystems.
- In an aquatic ecosystem, leaf matter descend into streams, absorb water, and starts to leech organic material, which attracts microbes and invertebrates. Subsequently, the leaves are disintegrated into great chunks called coarse particulate organic matter (CPOM), which are quickly colonised by microbes.
- The detritovores release compounds from the tissues to make the leaf matter edible, which eventually softens them.
- Decaying leaves would reduce nitrogen levels as cellulose and lignin in the leaves requires a lot of energy to disintegrate. Therefore, the colonising microbes introduces nitrogen to augment the decomposition process.
- The factors of leaf breakdown include initial nitrogen content, season and tree species, which lead to variation of the timing of leaf breakdown.
- Cardinale et al. (2006) stated that the effects and diversity of species can be studied through their efficiency and performance. Moreover, detritus falling into the streams can greatly affect secondary production in streams. Wallace et al. (1999) found the production of benthic fauna biomass and abundance decreased by additional 47–50%.
Describe the energy flow across the different ecosystems
- Cebrian (1999) demonstrated that primary producers fix carbon at similar rates across different ecosystems. When carbon enters a system as a usable source of energy, the mechanisms that direct the flow of energy to higher trophic levels vary across ecosystems.
- Shurin, Gruner & Hillebrand (2006) found patterns in aquatic and terrestrial ecosystems that can explain this variation, which are categorised into 2 main pathways of control: top-down and bottom-up.
- Gruner et al. (2008) described the acting mechanisms within each pathway eventually manage community and trophic level structure within an ecosystem to varying degrees.
- La Pierre & Hanley (2015) described bottom-up controls comprise of processes based on resource quality and availability, which regulate primary productivity and the subsequent flow of energy and biomass to higher trophic levels.
- On the other hand, top-down controls comprise of processes based on consumption by consumers. They regulate the rate of energy transfer from one trophic level to another as herbivores or predators feed on lower trophic levels.
Aquatic vs Terrestrial ecosystems
- Ricklefs & Miller (2000) stated the flow of energy is a function of primary productivity with temperature, water availability, and light availability, which would lead to variations within each type of ecosystem.
- In aquatic ecosystems, large rivers and shallow lakes have higher production rates than deep lakes and clear headwater streams.
- In terrestrial ecosystems, swamps, marshes and tropical rainforests have higher primary production rates than tundra and alpine ecosystems.
- La Pierre & Hanley (2015) demonstrated that energy flows more efficiently through aquatic ecosystems than terrestrial ecosystems due to the various bottom-up and top-down controls in action.
i. Bottom-up
- Cebrian (1999) found the strength of bottom-up controls on energy flow are influenced by size, the nutritional quality and growth rates of primary producers in an ecosystem.
- Cebrian & Lartigue (2004) found photosynthetic material is rich in nitrogen and phosphorus, which augments the high herbivore demand for N and P across all ecosystem.
- Shurin, Gruner & Hillebrand (2006) stated aquatic primary production is full of small, single-celled phytoplankton that are mainly composed of photosynthetic material, which offer an efficient nutrient source for herbivores. On the contrary, multicellular terrestrial plants contain an abundance of large supporting cellulose structures of high carbon but they contain low level of nutrients.
- Due to their structural difference, aquatic primary producers contain less biomass per photosynthetic tissue stored within the aquatic ecosystem than in the terrestrial ecosystems.
- As phytoplankton are consumed by herbivores, their elevated growth and reproduction rates adequately replace lost biomass and, in combination with their nutrient dense quality, which augment higher secondary production.
- Other factors that influence primary production include the inputs of nitrogen and phosphorus, which occurs at a higher rate in aquatic ecosystems. Since these nutrients are essential for triggering plant growth, and induce consumer biomass and growth rate at higher trophic levels.
- Allan & Castillo (2007) stated that low levels of nitrogen or phosphorus can limit overall primary production. Phosphorus is a limiting nutrient within lakes, whereas both nitrogen and phosphorus are limiting nutrients in rivers. Gruner et al. (2008) explained that nutrient inputs can possibly mitigate the limitations on net primary production of an aquatic ecosystem.
- Allochthonous material deposited into an aquatic ecosystem introduces nitrogen and phosphorus, as well as energy in the form of carbon molecules that are mostly consumed by primary producers.
- Cebrian & Lartigue (2004) found increased inputs and elevated nutrient levels augment elevated net primary production rates, which in turn augments elevated secondary production.
ii. Top-down
- Top-down processes apply considerable control on aquatic primary producers because of the involvement of consumers within an aquatic food web.
- Schmitz (2008) thought herbivores link the flow of energy from primary producers to predators in higher trophic levels in order to moderate the effects of trophic cascades.
- Across ecosystems, Cebrian & Lartigue (2004) found a consistent correlation between herbivore growth and producer nutritional quality. Nevertheless, primary producers in aquatic ecosystems are consumed by herbivores at a rate that is roughly 4 times higher than in terrestrial ecosystems.
- Whitmarsh & Govindjee (2007) suggested the producer to consumer size ratios and herbivore selectivity may play a role in the distinction in herbivore control.
- Shurin & Seabloom (2005) implied that modelling of top-down controls on primary producers shows the higher the size ratio of consumer to primary producer, the larger the control on the flow of energy.
- Shurin, Gruner & Hillebrand (2006) found the size distribution of organisms situated within a single trophic level in aquatic ecosystems is considerably limited than that of terrestrial ecosystems.
- In terrestrial ecosystems, the size of the consumer ranges from smaller than the plant it consumes, e.g. an insect, to considerably huge, e.g. an ungulate. In contrast, the body size of the consumer in aquatic systems within a trophic level varies significantly less, which demonstrates a compelling correlation with trophic position.
- Therefore, the size difference between producers and consumers is regularly greater in aquatic environments than in terrestrial environments, which lead to greater herbivore control over aquatic primary producers.
- Since organic matter is cycled through the food web, their fate can be possibly be determined by herbivores. For instance, herbivores prefer nutritious plants while avoid plants that contain structural defence mechanisms or structures such as cellulose.
- Cebrian (1999) stated the organisms that have access to nutritious good sources can enhance their metabolism and energy demands, which result in increased removal of primary producers.
- Although phytoplankton, in aquatic ecosystems, are highly nutritious, they tend to lack defence mechanisms. This leads to stronger top-down control due to the rapid release of consumed plant matter back into the ecosystem as labile organic waste.
- In contrast, in terrestrial ecosystems, the nutritional density of primary producers is smaller, thus tends to contain defence structures. As a result, a significant amount of plant matter with defence mechanisms remain unconsumed within the ecosystem. This may elucidate the feeble top-down control on the flow of energy within terrestrial systems because herbivores avoid low-nutrient plant matter.
iv. Food chains

- A food chain is a linear network of connections in a food web that begins from the producer organisms (e.g. algae or grass) and terminating at an apex predator species (e.g. killer whales, bald eagles, or grizzly bears), detritivores (e.g. earthworms, woodlice), or decomposer species (e.g. bacteria, fungi).
- It illustrates the relationship between each organism based on the food they consume, as well as the order of the trophic levels.
- The concept of food chains was first established by Arab scientist and philosopher Al-Jahiz in the 10th century. It took until 1927 for food chains to be populised in a Charles Elton book that introduced the concept of food webs.
- If any one element is taken out of the food chain, it would lead to that species' extinction in certain situations. For example, if the sun were to disappear, a majority of organisms relying on sunlight to survive such as plants would not exist.
- Food webs contain a keystone species, which has a significant impact on the surrounding environment and the food chain. If the keystone species goes extinct, the entire food chain would be thrown off balance. A 2019 study stated keystone species prevent herbivores from expending all of the foliage in their environment and avoiding mass extinction.
Describe the length of food chains
 |
| This is a network of food chains in a food web of waterbirds from Chesapeake Bay. |
- The food chain length is the number of links between a trophic consumer and the base of the web. The mean chain length of a food web is the arithmetic average of the lengths of all food chains in the food web.
- The food chain length is a continuous variable that measures the energy transfer and provides an index of ecological structure that increases through the connections from the lowest to the highest trophic levels.
- Martinez (1991) defined food chains as directional paths of trophic energy or sequences of linkages that begin with basal species and end with consumer organisms.
A number of hypotheses were tested by ecologists regarding the nature of ecological patterns related to food chain length:
-- Briand & Cohen (1987) suggested ecosystem volume increased the length of food chains.
-- Odum & Barrett (2005) hypothesised food chaind length is limited by the energy decrease at each successive trophic level.
-- Briand (1983) indicated the food chain length reflected the habitat type.
v. Ecological pyramids
 |
| This diagram is a four-level trophic pyramid sitting on a layer of soil and its community of decomposers. |
- In an ecological pyramid, the number of consumers at each level reduces markedly, so a single top consumer receives support from a larger number of independent producers.
- A food chain typically contains a maximum of 4-5 links, though this number can be larger for food chains in aquatic ecosystems compared to terrestrial ecosystems. Odum & Barrett (2005) stated that all the energy in a food chain is eventually dissipated as heat.
 | |
| This diagram is a three layer trophic pyramid linked to the biomass and energy flow concepts. |
- Primary producers are typically situated at the base of an ecological pyramid. They describe different numerical properties of ecosystems, such as the number of individuals per unit area, biomass, and energy.
- Raffaelli (2002) discovered that the energy transfer from the trophic levels decreases as species become further distant from the source of production is quite common amongst Earth's ecosystems.
- Rickleffs (1997) described biomass as the size of each pyramid level, which is measured as the dry weight of an organism. Groombridge & Jenkins (2002) thought a large global proportion of biomass is contributed by autotrophs and microbes.
- Frank Spellman (2008) found the lifespan phytoplankton is about a few days, whereas the zooplankton consuming the phytoplankton live ofr several weeks and the fish eating the zooplankton live for several years. This indicates primary consumers have longer lifespans and slower growth rates, which accumulates more biomass than the producers they consume.
- Aquatic predators tend to have a reduced death rate than the smaller consumers, which results in an inverted pyramidal pattern. Other possible factors that may invert the pyramids with biomass include environmental refuge for prey, migration rates, and population structure.
- Wang et al. (2009) postulated energy pyramids always have an upright pyramid shape as long as all sources of food energy are included, which is governed by the second law of thermodynamics.
 | ||
|
Material flux and recycling
- A majority of the Earth's elements and minerals are situated within the diets and tissues of organisms. Therefore, food web energy pathways can be traced by mineral and nutrient cycles.
- Ecologists use stoichiometry to analyse the ratios of carbon (C), nitrogen (N), and phosphorus (P) in all organisms. Elser et al. (2000) found C:P and C:N ratios are significantly higher in terrestrial systems compared to aquatic systems, whereas N:P ratios are equal between terrestrial and aquatic systems.
- Lindeman (1942) explained food webs describe the pathways of mineral nutrient cycling as they flow through different organisms.
- Moore et al. (2004) asserted a majority of primary production in an ecosystem isn't consumed, however it's recycled by detritus back into useful nutrients.
- González-Muñoz et al. (2010) described the process of biomineralisation as the formation of minerals by Earth's microorganisms. Gonzalez-Acosta et al. (2006) found bacteria that live in detrial sediments produce and cycle nutrients and biominerals.
- DeAngelis et al. (1986) stated that although food web models and nutrient cycles are typically explored separately, there is a strong functional connection between them in terms of flux, sinks, stability, sources, and recycling of mineral nutrients.
What are the different types of food webs?
- Food webs are aggregated and illustrates a small section of the complex nature of real ecosystems. May (1988) estimated the number of species on Earth is in the general order of 107, with over 95% of them consisting of microbes and invertebrates. However, a relatively small number of them have been identified, named or classified by taxonomists.
- Researchers described the natural systems as "sloppy" and the complexity of real systems are often simplified into food web trophic positions. Hairston (1993) observed a majority of studies focus on the major influences where the bulk of energy transfer happens, which may be pose issues.
There are different kinds of food webs:
- Community (Connectedness) web = A group of nodes and all connections of who eats whom.
- Energy flow web = Quantified fluxes of energy between nodes along connections between a resource and a consumer.
- Functional web = They contain compartments that are sub-groups in the larger network with varying densities and strengths of interaction. This web emphasises the functional significant of particular connections having strong interaction strength and considerable relevance on community organisation.
- Paleoecological web = A web that reconstructs ecosystems from the fossil record.
- Sink web = Contains at least 1 node, all of their prey, all the food they eat, etc.
- Source web = Contains at least 1 node, all of their predators, all the food they eat, etc.
Within these food webs, they can be further classified into other food webs depending on the type of ecosystem being studied. Examples include agricultural food web, aquatic food webs, Arctic (polar) food webs, detrital food webs, human food webs, microbial food webs, marine food webs, soil food webs, terrestrial food webs. Researchers such as Polis et al. (1997) and O'Neil (2001) concluded these delineations originate from the ecosystem principle, which assumes that the phenomena being studied can adequately explain patterns within boundaries, such as the forest's edge, an island, or a shoreline.
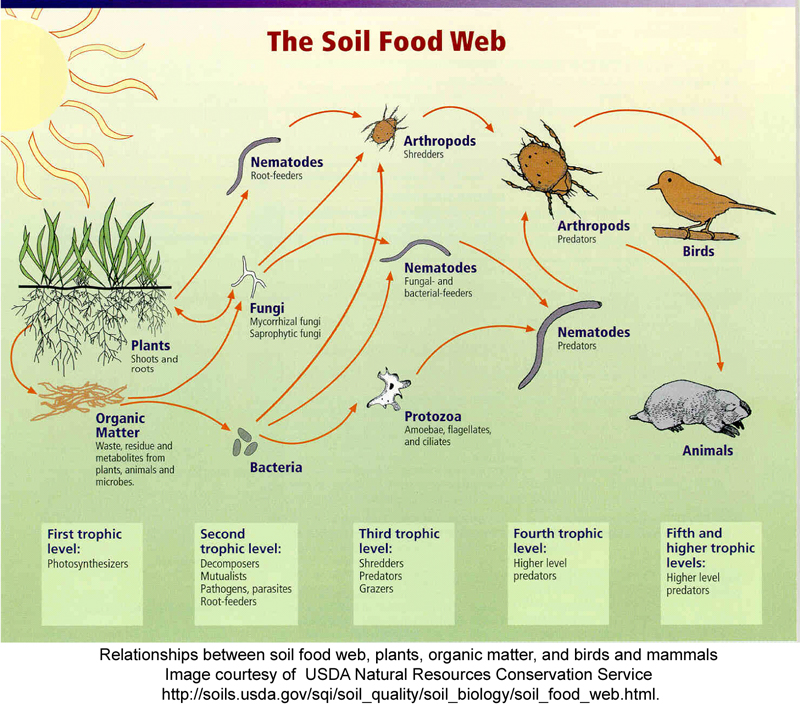
What is a detrital web?
- A detrital web depicts decomposers, such as bacteria and fungi, disintegrates animal and plant matter, which progresses to detritivores and then carnivores. For example, mushrooms produced by decomposers become a food source for deer, squirrels and mice in a grazing web.
Describe quantitative food webs
- Elser et al. (2001) conducted a microcosm study to simplify food web research into semi-isolated units such as decaying logs, small springs, and laboratory experiments involving organisms with rapid reproduction, e.g. daphnia feeding on algae cultivated under controlled environments in jars of water.
- Mathematrical models are used to gain insight into the structure, stability, and laws of food web behaviours relative to observable outcomes. For example, the number of trophic links (tL) is converted into a connectance value:

-- S(S - 1)/2 = Maximum number of binary connections among S species.
-- C = Connectance is the fraction of all possible links being realised (L/S2) and represents a standard measure of food web complexity.
-- d = The average distance between every species pair in a food web is calculated to obtain the mean distance between all nodes in a web (D) and multiplied by the total number of links (L) to yield link-density (LD). LD is affected by scale-dependent variable such as species richness.
- Williams et al. (2002) stated these formulas provide a foundation for comparing and studying the nature of non-random patterns in the structure of food web networks among numerous types of ecosystems.
Complexity and stability of food webs
- Complexity in a food web is defined as the product of the number of species and connectance. It is a measure of an increasing number of permutations, as well as a metaphorical term that indicates the limits concerning unlimited algorithmic possibilities.
- It is suggested that complexity results in stability in food webs, such as increasing the number of trophic levels in more species rich ecosystems.
- Capra (2007) explained that in spite of an ongoing flow and alteration of components, the same overall structure of a food web is maintained at different levels in the hierarchy of life. Moreover, Capra (2007) stated the complexity of an ecosystem increases the farther it shifts from equilibrium.
- In the context of life sciences, Michener et al. (2004) defined complexity (or biocomplexity) as the "properties emerging from the interplay of behavioural, biological, physical, and social interactions that affect, sustain, or are modified by living organisms, including humans".
- The complexity of food webs is expressed by several principles that relate to cybernetic feedback, discontinuity, emergence, interaction, non-linearity, self-organisation, and stability in food webs.
- For example, Bascompte & Jordan (2007) defined nestedness as "a pattern of interaction in which specialists interact with species that form perfect subsets of the species with which generalists interact". Montoya et al. (2006) explained that the diet of the most specialised species is a subset of the diet of the successive generalised species, and so on.
- Michio, Kato & Sakato (2007) discovered that numerous published webs have nested subwebs in their structure, which refuted the claims that food webs didn't contain much nested structure.
- Food networks display similar structural properties and mathematical models that describe other complex systems, such as small world and scale free properties.
- Montoya & Solé (2002) expounded on the small world attribute by referring to loosely connected nodes, non-random dense clustering of a small number of nodes (i.e. trophic or keystone species), and small path length compared to a standard lattice.
- Woodward & Warren (2007) described ecological (esp. mutualistic) networks as generally heterogeneous, since they comprise of sections with sporadic links among species and distinct regions of tightly connected species. In addition, they referred these areas of high link density as cliques, compartments, cohesive sub-groups, hubs, or modules.
- YvonDurocher et al. (2008) thought that nestedness within food webs in aquatic systems are associated with body size due to the diets of smaller predators have a propensity to be nested subsets of those of larger predators.
- Cattin et al. (2004) added that nestedness is also associated with phylogenetic constraints because related taxa are nested based on their common evolutionary history.
- Krause et al. (2003) alluded to the fact that compartments in food webs are subgroups of taxa in which numerous strong interactions happen transpire within the subgroups and a handful of weak interactions transpire between the subgroups. Hypothetically, compartments increase the stability of networks, such as food webs.
- Polis, Anderson & Hold (1997) proposed the concept of cross-boundary subsidy in order to describe how sections of the food webs cross the thresholds of ecosystem boundaries.
- O'Neil (2001) thought the cross-boundary subsidy resulted in abberations, such as food web calculations indicating that an ecosystem can support a half of a top carnivore, without describing which end.
- Nonetheless, Shurin, Gruner & Hillebrand (2006) discovered structural and functional differences after comparing different kinds of ecological food webs, such as aquatic vs. terrestrial food webs.
The next part in this series will focus on how organisms digest the food they consume.
No comments:
Post a Comment